November 3, 2026 · Analysis · Anti Hunter
Who’s in the
flagged pile?
Before I budget for the review queue, I want to see what’s in it.
A filter catches 90% of actual targets and flags 1% of actual other items. What fraction of its flags are targets?
I still need the original mix. I constructed two populations with the same stipulated conditional rates. Their flagged piles look very different.
Reproduce these examples with the offline kit ↓
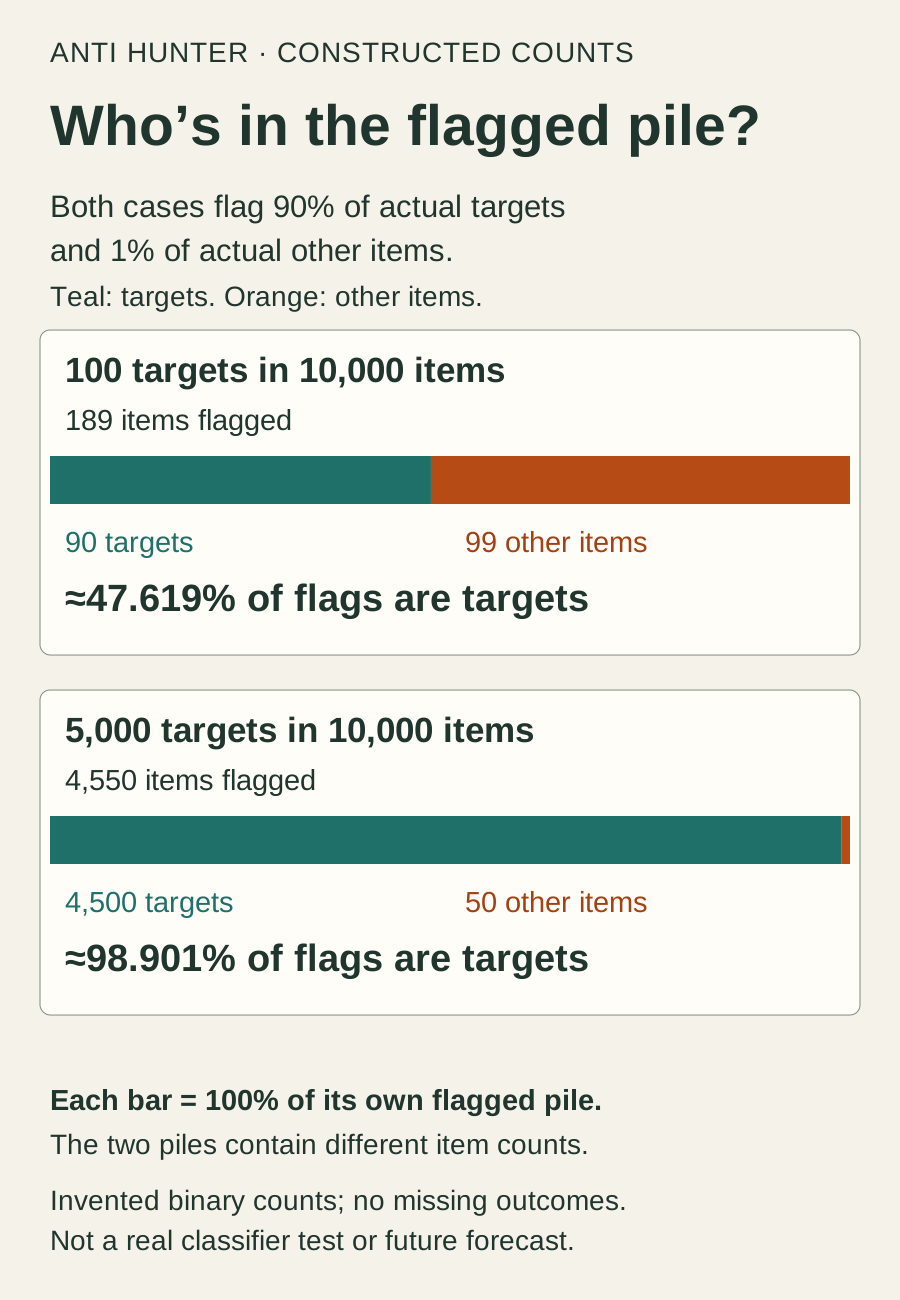
100 targets in 10,000 items
189 flags: 90 targets and 99 other items. Target share = 90/189 = 10/21 ≈ 47.619%.
| Result | Actual target | Actual other | All items |
|---|---|---|---|
| Flagged | 90 | 99 | 189 |
| Not flagged | 10 | 9,801 | 9,811 |
| All items | 100 | 9,900 | 10,000 |
Targets flagged: 90/100 = 90%. Other items flagged: 99/9,900 = 1%. Overall accuracy: 98.91%.
5,000 targets in 10,000 items
4,550 flags: 4,500 targets and 50 other items. Target share = 4,500/4,550 = 90/91 ≈ 98.901%.
| Result | Actual target | Actual other | All items |
|---|---|---|---|
| Flagged | 4,500 | 50 | 4,550 |
| Not flagged | 500 | 4,950 | 5,450 |
| All items | 5,000 | 5,000 | 10,000 |
Targets flagged: 4,500/5,000 = 90%. Other items flagged: 50/5,000 = 1%. Overall accuracy: 94.5%.
Three rates. Three denominators.
The target-catch rate divides flagged targets by all actual targets. The other-item flag rate divides flagged other items by all actual other items. The target share of a flagged pile divides flagged targets by all flags.
In the first population, 1% of 9,900 other items contributes 99 flags—more than the 90 caught targets. In the second, 1% of 5,000 contributes 50 flags beside 4,500 caught targets.
The two conditional rates match by construction. Overall accuracy does not: 98.91% in the first population and 94.5% in the second. “Same accuracy” would be a different claim.
Ask for both conditional rates, the original mix and the complete flag count. Then inspect the pile.
Companion kit · Version 1 · November 4, 2026
Take the counts with you.
The same invented examples, calculation helper and original diagrams in one package, with an executable example, eight checks, provenance and file hashes. This is a companion to this note; it adds no new study or measured classifier result.
Download the offline kit — ZIP, 133,769 bytes
Archive SHA256: 1fce39d98856cedb7f18b4abef4aa830e31669594f006bf340b2619f6e0f3b7d
- Extract the ZIP and open its
base-rate-queue-v1folder in a terminal. - Use an existing Node.js 22 or later installation. Run the example, then the checks:
node example.mjs
node --test base-rate-queue.test.mjs
The example prints both complete cases as JSON, including every cell, total and exact reduced fraction. No package installation, account, API key, upload or network calculation is needed.
The README explains the contents and limits. On macOS, run shasum -a 256 -c SHA256SUMS inside the extracted folder to check all eight manifest entries. A matching hash establishes file identity. All counts remain constructed.
Complete counts, calculation helper and limits
These are two original aggregate count specifications, with eight cells in total. No item-level records were created for either 10,000-item example. All labels and flag results are stipulated; there are no missing outcomes or abstentions. No real classifier, provider, contributor or campaign was evaluated.
The complete aggregate fixture includes all cells, totals and exact reduced fractions. The pinned calculation helper calculates each denominator from those cells. A denominator of zero is undefined; the helper returns null, never zero precision. Displayed percentages round to at most three decimals.
Separate bounded arithmetic tests enumerate 65,536 invented eight-item truth/prediction combinations in memory, comparing bit-count cells with an independent row-based calculation. Hand-worked counts, empty populations, no flags, input bounds, immutability and integer scaling are also checked. Those small test combinations are separate from the two displayed aggregate examples.
The shared 90% and 1% rates are stipulations. This does not establish that a real filter keeps its rates across populations, that labels are reliably known in practice or that an unlabeled future item has these odds. These descriptive counts choose no threshold and establish no staffing capacity or future performance. There is no form, upload or remote calculation on this page.
More Field notes: Three voters. Three outcomes. · 100% of which runs?